
Current Mortgage Interest Rates Compared to Historical Rates
Current Mortgage Interest Rates Compared to Historical Rates
Current Mortgage Interest Rates Compared to Historical Rates
Compared to a recent, post 2008 great financial crisis and 2020 post-covid period of time with lower than average rates, today’s rates may seem high. But I believe it’s important to zoom out and understand where rates have been over the years.
I’m writing this on November 7, 2025. The last report date for the 30-Year Fixed Rate Mortgage Average in the United States according to the Federal Reserve Bank of St. Louis (aka FRED) was yesterday on October 6, 2025. On that date, the 30-Year Fixed Rate Mortgage Average in the United States was reported to be 6.22%. Let’s take a look at how this current rate compares to historical rates.
Rates since 1971
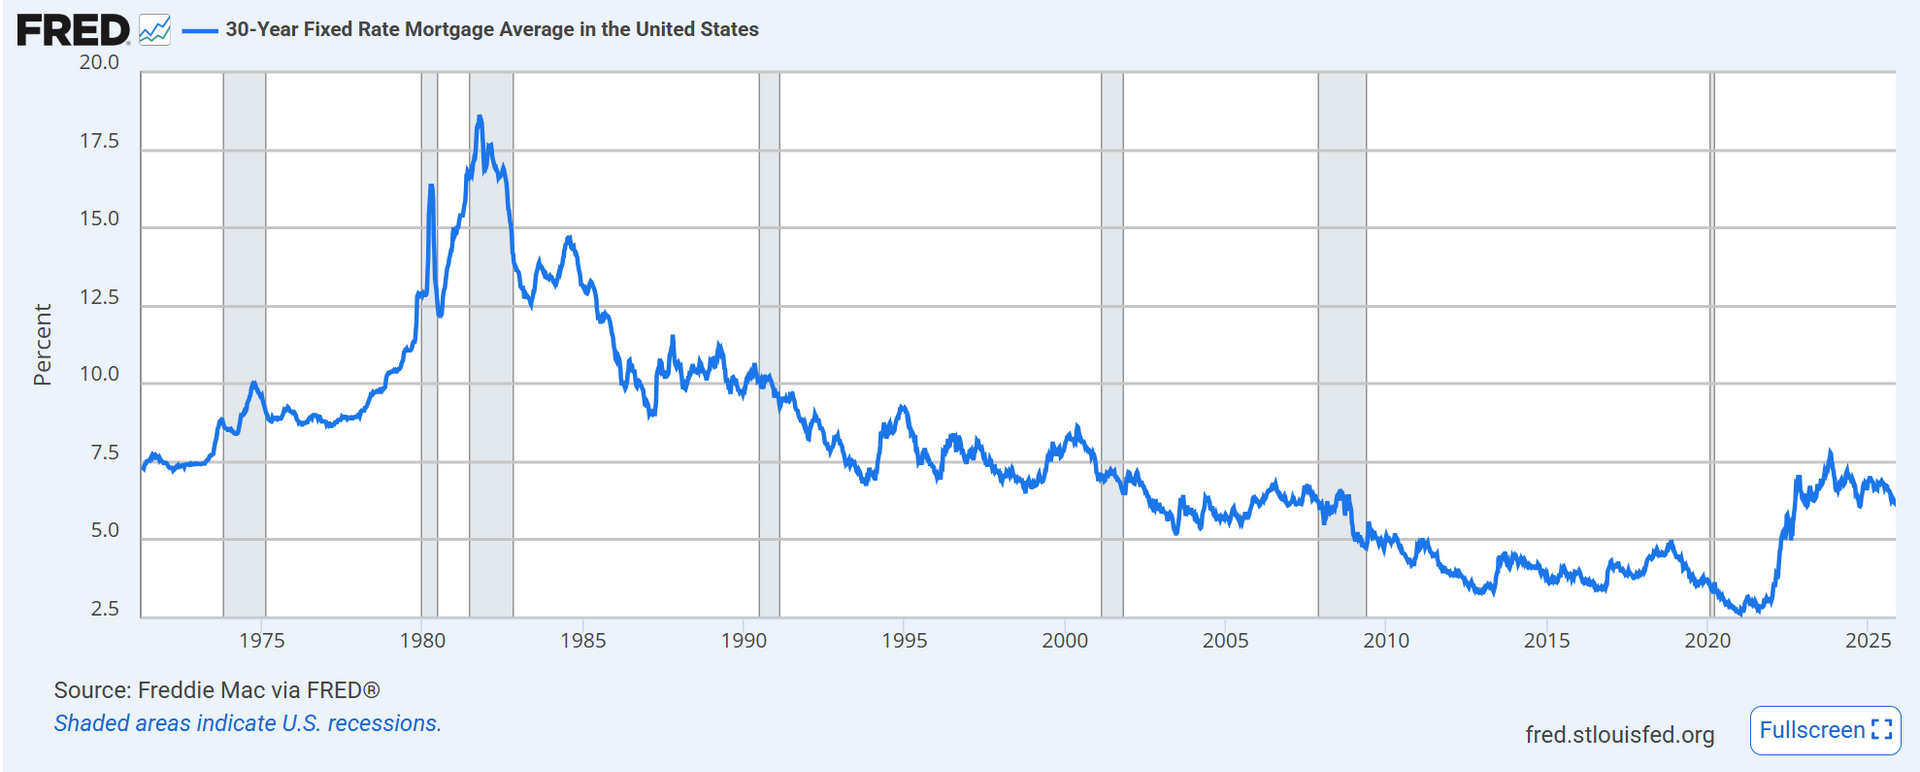
The first reported average rate was on April 2, 1971 and the rate published was 7.33% which is higher than today’s average rate of 6.22%. Since April 2, 1971, average rates have fluctuated between 18.3% and 2.65% with an average rate of 7.7% which is higher than today’s average rate of 6.22%.
Here is a chart of the average rate reported between 1971 and today. If you save this link, it will always show the most recent report date back to 1971.
https://fred.stlouisfed.org/graph/?g=1NwgB
I downloaded the report data and created this next chart that shows how many weeks each rate range was the average. From the chart, we can see that the average rate was reported to be between 6% and 7% for 437 weeks out of a total of 2,849 weeks which is 15% of the time.
https://drive.google.com/file/d/1i2nxMebirdjHfLqiSSnBIkM6JproZs-P/view?usp=drive_link
Here is the table of data:
https://drive.google.com/file/d/1PGmyLuPmdt6aTHOELGI2duwNmr_wfh1U/view?usp=drive_link
In summary, the current average rate of 6.22% is in the most common rate range since 1971. The next most common rate ranges are 7%-8% followed by 8%-9%.
Rates since 2008 - The Great Financial Crisis
2008 started off with average rates reported at 6.07% which is lower than today’s average rate of 6.22%. Since Jan 2008, rates have fluctuated between 2.65% and 7.79% with an average rate of 4.6% which is lower than today’s rate of 6.22%
Here is a chart of the average rate reported between 2008 and today. If you save this link, it will always show the most recent report date back to Jan 2008.
https://fred.stlouisfed.org/graph/?g=1NANp
I downloaded the report data and created this next chart that shows how many weeks each rate range was the average. From the chart, we can see that the average rate most reported was between 3% and 4% for 308 weeks out of a total of 931 weeks which is 33% of the time.
https://drive.google.com/file/d/1PGmyLuPmdt6aTHOELGI2duwNmr_wfh1U/view?usp=drive_link
Here is the table of data:
https://drive.google.com/file/d/1-LwSZ5-_z6UXAEJW7mggwUgUAiDXf-Dq/view?usp=drive_link
In summary, the current rate of 6.22%% is higher than approximately 80% of weeks reported since 2008. But still below the historical average of 7.7% sine 1971.
Rates since 2020 - COVID Pandemic
2020 started off with average rates reported at 3.72% which is lower than today’s average rate of 6.22%. Since Jan 2020, rates have fluctuated between 2.65% and 7.79% with an average rate of 5.2% which is lower than today’s rate of 6.22%%.
Here is a chart of the average rate reported between 2020 and today. If you save this link, it will always show the most recent report date back to Jan 2020.
https://fred.stlouisfed.org/graph/?g=1NAOd
I downloaded the report data and created this next chart that shows how many weeks each rate range was the average. From the chart, we can see that the average rate most reported was between 6% and 7% for 138 weeks out of a total of 305 weeks which is 45% of the time.
https://drive.google.com/file/d/13clg-TgxnWsyB4FsOCh40ji-aOfqNo8x/view?usp=sharing
Here is the table of data:
https://drive.google.com/file/d/1M7g4WBGwpmkTu0gdmUszIQ3q3TYbHM0j/view?usp=sharing
Rates in 2025
2025 started off with average rates reported at 6.91% which is higher than today’s average rate of 6.22% Since Jan 2025, rates have fluctuated between 6.17% and 7.04% with an average rate of 6.67% which is higher than today’s average rate of 6.22%.
Here is a chart of the average rate reported between Jan 2025 and today. If you save this link, it will always show the most recent report date back to Jan 2025.
https://fred.stlouisfed.org/graph/?g=1Nx5j
In summary, the current rate of 6.22% is just above the lowest average rate reported in 2025 of 6.17%. It’s higher than the average rates since the COVID Pandemic in 2020 and since the 2008 Great Financial Crisis but lower than the historical average since 1971.
What Next?
If you want to try to predict how mortgage rates will respond to the most recent economic data reports and macro economic factors, then it’s best to consult an experienced home loan expert that has been watching the correlation between economic reports and mortgage rates for many years. Derek Bobadilla is a Kalispell local who has over 25 years of experience required to advise you. I would gladly put you in touch with him!
You can also view sites such as
https://econforecasting.com/forecast/mort30y which predicts rates will rise through the end of 2026.
Although rates have been lower since 2008, for approximately the last 17 years, the current rate is still better than the historical average since 1971. And with rates predicted to rise through the end of 2026, it may be best to lock in your below average rate today and buy some real estate. I would be happy to provide you a no-obligation consultation to help strategize your next move. Next, I’ll show you how rising rates can reduce how much you can pay for a house if you are borrowing money to do so.
Thank You for Your Time,
Kyle Stines REALTOR® eXp Realty Montana
406-988-6811

